Selection and validation of RT-qPCR reference genes for multi-tissue gene expression normalization in two honeybee subspecies across post-emergence developmental stages
Selection and validation of RT-qPCR reference genes for multi-tissue gene expression normalization in two honeybee subspecies across post-emergence developmental stages
Background
The western honeybee (Apis mellifera) represents a pivotal model organism for investigating social organization and phenotypic plasticity. Behavioral specialization in worker bees induces tissue-specific molecular adaptations, particularly in sensory and secretory tissues. Although real-time quantitative PCR (RT-qPCR) has been extensively employed to quantify gene expression dynamics in these tissues, systematic evaluation of optimal reference genes for RT-qPCR data normalization remains undressed.
Results
We systematically assessed nine candidate reference genes across three tissues (antennae, hypopharyngeal glands, and brains) in adult honeybees at three developmental stages (newly emerged bees, nurses, and foragers) from two subspecies (A. m. ligustica and A. m. carnica). Using five statistical algorithms (geNorm, NormFinder, BestKeeper, ΔCT method, and RefFinder), we identified ADP-ribosylation factor 1 (arf1) as the most stable reference gene across all experimental conditions, followed by ribosomal protein L32 (rpL32). Their stability was confirmed by experimental validation through normalization of major royal jelly protein 2 (mrjp2) expression patterns. Notably, three conventional housekeeping genes (α-tubulin, glyceraldehyde-3-phosphate dehydrogenase, and β-actin) displayed consistently poor stability, disqualifying their application in quantitative analyses under these experimental conditions.
Conclusions
Our findings provide validated reference genes for precise quantification of tissue-specific gene expression patterns during adult honeybee development. These reference genes facilitate identification of candidate genes associated with honeybee development, social behavior, and productivity traits.
Introduction
The western honeybee (Apis mellifera) serves as a key model organism for social behavior, with its sophisticated social organization playing a vital role in sustaining global ecosystems through essential pollination services [1, 2]. Within honeybee colonies, the specialization in the division of labor reflects a highly evolved and intricate social structure [3]. Specifically, newly emerged worker bees (1–3 days post eclosion) primarily perform cell cleaning tasks in the hive [4]. At 4–12 days of age, they engage in nursing duties by feeding royal jelly, a proteinaceous secretion of their hypopharyngeal glands, to developing larvae and the queen [5]. Middle-aged workers (12–21 days) undertake various tasks including nest building, nectar receiving and processing, and guarding the hive entrance [6]. Older workers at 21 days of age switch to foraging outside the hive for pollen, nectar, water, and other resources [7]. Notably, the behavioral development exhibits remarkable plasticity rather than strict age-dependency, being modifiable through acceleration, delay, or even reversal according to colony demands [8,9,10,11].
Nurses and foragers exhibit distinct physiological and molecular adaptations tailored to their specialized roles. Notably, nurses exhibit well-developed hypopharyngeal glands with robust secretory capacity for royal jelly production, complemented by increased antennal sensitivity to larval and queen-derived pheromones [12]. This contrasts sharply with foragers, whose hypopharyngeal glands are atrophied with reduced secretion activity [13], while their antennae are more sensitive to nectar and pollen outside the colony [14]. These specializations align with the brain's pivotal role as the central nervous system regulator of behavioral programming, including division of labor in honeybees [15]. Differentially expressed genes in these tissues are proposed to be involved, either directly or indirectly, in task-specific behavioral execution [16,17,18]. Moreover, adaptive changes in global gene expression profiles in these tissues of newly emerged bees, nurses, and foragers are reported to prime the elevated secretion of royal jelly in a high royal jelly-producing strain (A. m. ligustica) [19,20,21]. Accurate quantification of gene expression levels in these specialized tissues is therefore essential to elucidate molecular mechanisms underlying developmental plasticity, behavioral transition, and differential production performance in adult honeybees.
Real-time quantitative PCR (RT-qPCR) is the most sensitive and reliable method for precise detection and quantification of target mRNA expression levels [22, 23]. To ensure reliable results, this technique necessitates systematic normalization to account for variations in initial mRNA input quantity and quality, as well as PCR amplification or cDNA synthesis efficiency [24]. Application of internal reference genes with stable expression levels remains the predominant normalization approach; however, commonly used reference genes often exhibit instability under varying experimental conditions [25, 26]. This underscores the critical need to select suitable reference genes for specific experimental conditions to ensure reliable RT-qPCR results.
Stable reference genes for honeybees have been identified under varying conditions, such as rpS5 and rpS18 for seasonal variations [27], rab1 and arf1 under pesticide treatment [28], and rab1 across developmental stages [29]. However, these findings are primarily based on whole-body specimens or body segments (head, thorax, and abdomen), which may obscure tissue-specific expression variations of these reference genes. This issue is demonstrated by significant tissue-specific variations in reference gene transcript levels in newly emerged honeybee queens [30]. Gene expression quantification in specialized honeybee tissues (antennae, hypopharyngeal glands, and brains) has been widely conducted to investigate developmental plasticity [31, 32], labor of division [16,17,18], and differential performance in royal jelly production [33, 34]. Such studies frequently employ common reference genes (e.g. actin, gapdh, and α-tub) for normalization without stability validation, thereby compromising the reliability of gene expression quantification.
To address this gap, we evaluated the expression stability of nine candidate reference genes in two honeybee subspecies (A. m. ligustica and A. m. carnica) across adult developmental stages (newly emerged, nurses, and foragers) and tissues (antennae, hypopharyngeal glands, and brains). These candidate reference genes included actin, ef1, rpS18, gapdh, rpS5, α-tub, rab1, arf1, and rpL32, which have been widely used in honeybees [28, 29, 35, 36]. Their stability was assessed by five commonly used programs, i.e. BestKeeper, NormFinder, geNorm, ΔCT, and RefFinder, and validated by normalizing the expression of major royal jelly protein 2 (mrjp2). To evaluate the reproducibility of our data analysis, the stability ranking of rpL32 was assessed and compared using two pairs of primers. Our study provides technical support for investigating tissue-specific gene expression and functional dynamics throughout adult honeybee development.
Materials and methods
Honeybee collection
Colonies of Carniolan bees (A. m. carnica) and a high royal jelly-producing strain, which was derived through selective breeding from Italian bees (A. m. ligustica), were reared at the apiary in Institute of Apicultural Research, Chinese Academy of Agricultural Sciences, Beijing, China. The queens of A. m. carnica were obtained from Institute of Apicultural Science, Jilin, China, and the high royal jelly-producing strain queens were acquired from an apiary in Anhui, China. For each subspecies, 30 newly emerged bees, 30 nurses, and 30 foragers were collected from each colony and pooled by developmental stages for preservation. Emerging brood frames were placed in an incubator in darkness (34 ± 1 °C and 50% humidity). Newly emerged bees were collected within 12 h of their emergence. In bee hives, honeybees keeping their heads and thoraxes inside brood cells for more than 10 s were collected as nurses, and those returning to the hive entrance with pollen pellets attached to their hind legs were collected as foragers [17]. The collected samples were immediately frozen with liquid nitrogen and stored at −80°C.
Total RNA extraction and cDNA synthesis
Brains, hypopharyngeal glands, and antennae of the collected honeybees were individually dissected under an optical microscope (Leica, Wetzlar, Germany) following the procedures described previously [37]. Ten brains, five pairs of hypopharyngeal glands, and 18 pairs of antennae were each pooled as a biological sample (n = 5 for each tissue). Total RNA was extracted using TRIzol reagent (Invitrogen, Carlsbad, USA) according to the manufacturer’s instruction. RNA concentration and purity were determined using the NanoDrop2000 Spectrophotometer (Thermo Fisher Scientific, Waltham, USA). A total of 90 RNA samples (3 tissues × 3 stages × 2 subspecies × 5 replicates) were prepared for subsequent assay. Equal amount of RNA (1 μg) was reverse-transcribed into cDNA using a PrimeScript™ RT reagent Kit (TaKaRa, Shiga, Japan).
Primer design and evaluation
Nine candidate reference genes that were widely used in insects including honeybees [35, 36] were selected in our study. The nucleotide sequences of these genes were retrieved from the NCBI database (https://www.ncbi.nlm.nih.gov). Specific primers were designed using Primer Premier 5 (Premier Biosoft, San Franciso, USA). Two pairs of primers for rpL32 were designed to assess the reproducibility of the whole analysis.
To evaluate amplification efficiency of these primers, absolute quantification of the candidate reference gene expression was conducted. Briefly, the aforementioned primers and equally pooled cDNA samples were used for PCR amplification with TaqTM polymerase (TaKaRa, Shiga, Japan). The reaction conditions were set as below: 95 °C for 5 min; 35 cycles of 95 °C for 15 s, 58 °C for 15 s, and 72 °C for 15 s; 72 °C for 5 min. PCR products were visualized on 1.5% agarose gels to ensure amplification specificity, followed by purification using AxyPrep DNA gel extraction kit (Axygen, San Francisco, USA) and subsequent ligation into pMD™ 19-T vector (TaKaRa, Shiga, Japan). Recombinant plasmids were transformed into Trans1-T1 chemoreceptor cells (TransGen Biotech, Beijing, China). Plasmid DNA was purified from positive clones using AxyPrep™ Plasmid Miniprep Kit (Axygen, San Francisco, USA). Following sequence confirmation by Sanger sequencing, the plasmid DNA was diluted serially in a 10-fold gradient (1×10⁵–1×10⁹ copies) as RT-qPCR templates to establish standard curves. The regression coefficient (R2) obtained from the linear regression equation was used to evaluate each standard curve. The amplification efficiency (E) of each pair of primers was calculated from the given slope in the standard curves using following formula: E = (10(–1/slope)–1)×100%.
Real-time quantitative PCR
All RT-qPCR reactions were performed on a LineGene 9600 Plus thermalcycler (Bioer Technology, Hangzhou, China) with TB Green® Premix Ex Taq™ II (TaKaRa, Shiga, Japan). The reaction conditions were as follow: 95 °C for 30 s, followed by 40 cycles at 95 °C for 5 s, 55 °C for 30 s, and 72 °C for 30 s. Melting curve analysis was conducted in the temperature range of 60–95°C to test amplification specificity of the primers. All the reactions were performed in duplicate and an average CT value was determined for each sample.
Stability analysis
The stability of the reference genes were evaluated using BestKeeper, geNorm, NormFinder, ΔCT method, and RefFinder. BestKeeper calculates standard deviation (SD) of the CT values, with lower SD values signifying a higher stability of gene expression [38]. geNorm estimates expression stability values (M value) for each gene, with lower M values indicating more stable expression patterns. Moreover, geNorm calculates the pairwise variation (Vn/Vn+1) to determine the optimal number of reference genes for accurate normalization [24]. NormFinder calculates stability values based on overall expression variation, wherein lower stability values indicate higher expression stability [39]. The ΔCT method employs mean standard deviation (mSD) to assess the stability of reference genes, identifying a higher stability with lower mSD values [40]. RefFinder integrates the rankings generated by the above algorithms, and performs a comprehensive ranking evaluation to identify optimal reference genes [41].
Validation of reference gene selection
To validate the normalization effect of candidate reference genes, the two most and two least stable reference genes identified by the five algorithms were each used to normalize mrjp2 expression in hypopharyngeal gland samples across developmental stages of A. m. ligustica. The expression levels of mrjp2 in hypopharyngeal glands are significantly higher in nurses than in newly emerged bees and foragers [42]. The primer sequences of mrjp2 were obtained from a previous study [43]. The 2-ΔΔCT method was employed to quantify relative expression levels [44]. One-way ANOVA followed by Tukey's multiple comparison test was performed to analyze the significance (p < 0.05) of differences using SPSS Statistics 25 (IBM Corp., Armonk, NY).
Results
Primer evaluation of the candidate reference genes
Amplification specificity and efficiency of the designed primers for the candidate reference genes were initially evaluated. All PCR products were visualized on 1.5% agarose gel and a single band of expected size for each gene was observed (Fig. 1). Furthermore, the sequences of the amplified bands were correctly verified by Sanger sequencing. Moreover, all the candidate reference genes had high linear regression coefficients (R2 >0.990) and amplification efficiency (92.1%−114.5%) in established standard curves (Table 1). These results reveal high specificity and efficiency of the designed primers.

PCR products of candidate reference genes visualized on 1.5% agarose gel
Expression patterns of the candidate reference genes
The expression of the candidate reference genes under different conditions was profiled to provide an overall assessment of their stability (Fig. 2). actin showed the highest expression level with the lowest average CT value of 17.01, while α-tub showed the lowest expression level with the highest CT value of 23.78. Among the candidate reference genes, α-tub, actin, and gapdh showed the highest variation in CT values, with a CT range (XMax-XMin) of 9.62, 9.45, and 9.12, respectively, was indicative of the lowest stability of these genes. In contrast, arf1, ef1, and rab1 were found to have the smallest CT range of 5.40, 6.40, and 6.96, respectively, and thus displayed the highest stability.
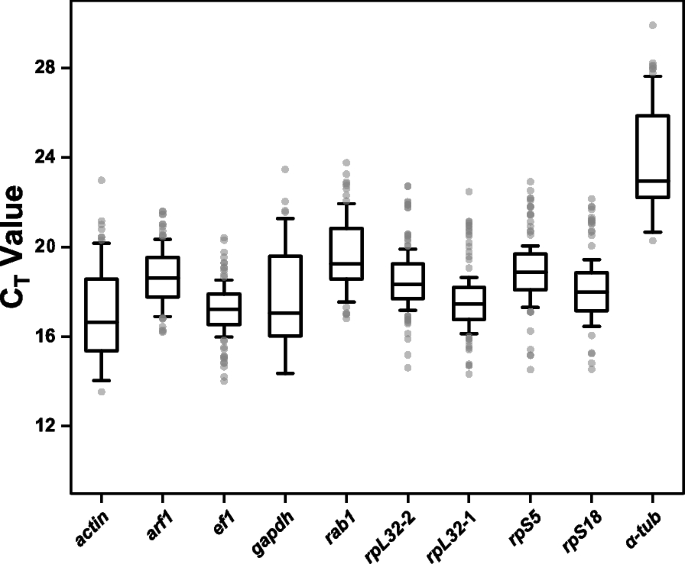
CT values of the candidate reference genes. The upper and lower quartiles and median are represented by the two ends of the box and the band inside the box, respectively. The ends of the whisker represent the lowest and highest values, still within the quartile range between 1.5 of the upper and lower quartiles
Stability analysis of the candidate reference genes
BestKeeper
Based on the results of BestKeeper, ef1 and arf1 were identified as the two most stable genes with the lowest SD values of 0.99 and 1.02, respectively (Fig. 3A). α-tub exhibited the lowest stability with the highest SD value of 1.84, followed by gapdh (1.76) and actin (1.70). The stability order of all genes was: ef1 >arf1 >rpS5 >rpL32−2 >rpL32−1 >rpS18 >rab1 >actin >gapdh >α-tub.
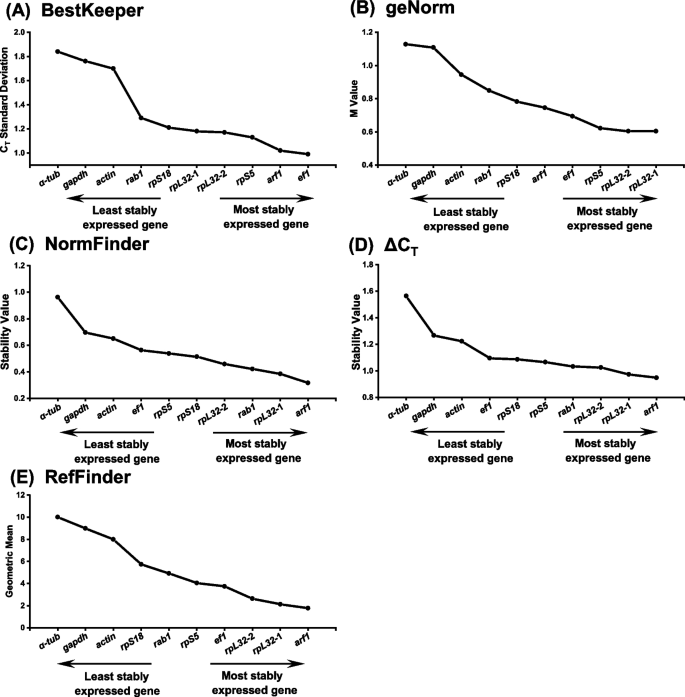
The expression stability values of the candidate reference genes calculated by five algorithms
geNorm
The average expression stability values (M values) for each reference gene were calculated by the geNorm algorithm. The stability order of all genes was: rpL32−1/rpL32−2 >rpS5 >ef1 >arf1 >rpS18 >rab1 >actin >gapdh >α-tub (Fig. 3B). This analysis showed that rpL32 was the most stable reference genes with the lowest M value of 0.603, followed by rpS5 (0.622), ef1 (0.694), and arf1 (0.746). α-tub, gapdh, and actin displayed the lowest stability with M values of 1.128, 1.019, and 0.944, respectively.
To identify the optimal number of reference genes for normalization, pairwise variation (Vn/Vn+1) values were calculated by geNorm with a cutoff value of 0.15 [24]. The values for V2/V3 and V3/V4 were 0.185 and 0.169, respectively (Fig. 4). The value for V4/V5 (0.142) was below the cutoff value, indicating that the inclusion of a fifth gene had no significant effect. A combination of four reference genes would be thus appropriate for accurate normalization in the present experimental conditions.

Pairwise variation analysis by geNorm to determine the optimal number of reference genes for normalization. The dotted line indicates the cutoff value for the suggestion of an optimal number of reference genes
NormFinder
The NormFinder analysis indicated that arf1 exhibited the highest stability with a stability value of 0.317, followed by rpL32−1 (0.385) and rab1 (0.421) (Fig. 3C). The remaining genes were ranked as: rpL32−2, rpS18, rpS5, ef1, actin, gapdh, and α-tub. Among them, α-tub, gapdh, and actin were recognized as the least stable reference genes with stability values of 0.962, 0.697, and 0.650, respectively.
ΔCT method
arf1 had the lowest mSD value of 0.948 and was identified as the most stable reference gene by the ΔCT method (Fig. 3D). rpL32−1 was found to be the second most stable gene with a mSD value of 0.974. In contrast, α-tub with the largest mSD value of 1.564 was identified as the least stable reference gene, followed by gapdh (1.267) and actin (1.223).
RefFinder
RefFinder was used to integrate the rankings of the candidate reference genes in the above algorithms. arf1 and rpL32 were found to be the two most stable reference genes with the lowest geometric mean of 1.778 and 2.115, respectively, whereas α-tub (10), gapdh (9), and actin (8) were still recognized as the least stable reference genes (Fig. 3E). The stability order of all genes was: arf1 >rpL32−1 >rpL32−2 >ef1 >rpS5 >rab1 >rpS18 >actin >gapdh >α-tub.
Selection of optimal reference genes
The overall rankings indicated that arf1 was the most stable reference gene in the present experimental conditions. Notably, it was ranked first in three algorithms (RefFinder, ΔCT method, and NormFinder) and second in BestKeeper. Although with a medium stability in geNorm, arf1 had a stability value (0.746) close to that of the most stable gene (0.603). rpL32 could serve as the second most stable reference gene due to its first and second ranking positions in one (geNorm) and three (RefFinder, ΔCT method, and NormFinder) algorithms, respectively. The high stability of rpL32 was confirmed by the observed close ranking positions between the usage of two pairs of primers in all algorithms. In contrast, α-tub, gapdh, and actin occupied the last three ranking positions in all the tested algorithms and could thus be regarded as the least stable reference genes.
Validation of reference genes
To validate the expression stability of our selected reference genes, the two most (arf1 and rpL32−1) and two least (α-tub and gapdh) stable reference genes were each used to normalize the expression of mrjp2 in hypopharyngeal glands at different developmental stages of A. m. ligustica. With arf1 or rpL32−1 as a reference gene, mrjp2 was found to have higher expression levels in nurses (p < 0.05), consistent with previous findings [42]. After normalization to gapdh or α-tub, however, much larger variations in mrjp2 expression levels were observed. When normalized to gapdh, significantly higher expression levels of mrjp2 in nurse bees relative to forager bees were not recovered (Fig. 5).

mrjp2 expression levels normalized by four selected reference genes. The result is presented as mean ± standard error (SE), and columns with different letters indicate statistically significant differences (p < 0.05)
Discussion
In this study, we aimed to identify optimal reference genes for normalizing tissue-specific gene expression across adult honeybee developmental stages. To this end, we evaluated the expression stability of nine candidate reference genes across three honeybee tissues (antennae, hypopharyngeal glands, and brains) at three developmental stages (newly emerged, nurses, and foragers) in two subspecies (A. m. ligustica and A. m. carnica). Under these conditions, arf1 exhibited the highest expression stability, followed by rpL32, whereas α-tub, gapdh, and actin consistently ranked as the least stable across five statistical algorithms. Their stability was further validated by normalizing the expression of mrjp2.
The protein encoded by arf1 is ubiquitous in eukaryotic cells and acts as a regulator of vesicle transport and actin remodeling [45]. In the present study, we provided ample evidence for the highest stability of arf1 in three tissue samples across three developmental stages of two subspecies of A. mellifera (Fig. 3). Furthermore, a higher expression of mrjp2 in nurses [42] was recovered with low variation levels when normalized to arf1 (Fig. 5), confirming the validity of this reference gene. It can thus be used as the best single reference gene for gene expression normalization under the present experimental conditions. The high stability of arf1 has also been reported in other conditions involving this species, e.g., pesticide exposure [28] and developmental stages from larvae to adults [29]. In addition, arf1 has been proposed to be one of the most stable reference genes in other insects [46, 47] and even plants [48, 49]. It should be noted, however, that a lower stability of arf1 has been reported in some cases [36, 50]. This highlights the importance of validating the suitability of arf1 as a reference gene in cases beyond our experimental conditions.
rpL32, formerly known as rp49, encodes a protein of the 60S ribosomal subunit involved in protein translation [51]. In this study, it was found to be the second most stable reference gene. The high stability of rpL32 was confirmed by mrjp2 expression normalization (Fig. 5) and similar top-ranking positions using two pairs of primers (Fig. 3). It has been reported that rpL32 expression remained stable after the pyrethroid insecticide treatment [52] and dsRNA injection [53] in A. mellifera. Similar observations have been documented in reference gene screening in other insects, such as both sexes of the dark black chafer (Holotrichia parallela) under varying photoperiod conditions [54] and across tissues and developmental stages in male individuals of the predatory stink bug (Eocanthecona furcellata) [55].
In addition to the relative ranking positions, cutoff values in the algorithms are suggested to be considered for reference gene stability evaluation. The proposed cutoff values include values < 0.15 in NormFinder [39, 56], SD values < 1 in BestKeeper [38, 56], and M < 0.5 [56] or M < 1.5 [57] in geNorm. However, even the two most stable genes, arf1 and rpL32, were only found to fulfill M < 1.5 in geNorm. The main reasons could be attributable to the sampling strategies in our study. Unlike previous sampling of partial (head, thorax, and abdomen) or whole bodies of honeybees [27, 57,58,59], our samples were obtained from single tissues (hypopharyngeal glands, antennae, and brains), which may disclose tissue-biased variations in gene expression. Our sampling strategy based on all combinations of the three conditions (tissues, developmental stage, and subspecies) may constitute another source of variation. Similar stability values that fail to meet the thresholds have been reported in selected reference genes and absolute cutoff values are not always taken into consideration [28, 52, 57,58,59]. It is worth noting that the adoption of a fixed cutoff value is even thought to be arbitrary [23].
Target gene normalization with multiple reference genes is desirable to minimize systematic bias. Pairwise variation (Vn/Vn+1) values with a cutoff value of 0.15 in geNorm are used to indicate the optimal number of reference genes for normalization [24]. However, due to time and cost constraints, studies involving multiple reference genes for normalization are limited. It should also be noted that a cutoff value of 0.15 without proper statistical verification is deemed arbitrary [23]. Although a combination of four reference genes was recommended in our experimental conditions (Fig. 4), normalization of mrjp2 expression levels using one of the two most stable reference genes (arf1 and rpL32) is valid (Fig. 3). They could thus serve as the best single reference genes under the present experimental conditions.
actin, gapdh, and α-tub are widely used for target gene expression normalization in insects including A. mellifera [18, 31, 60,61,62]. In this study, however, they were all consistently found to be least stable in all the five algorithms, as was further validated by the poor performance in mrjp2 expression normalization. The lack of expression stability of these reference genes has also been reported in A. mellifera under various treatments and conditions, such as various developmental stages [29], pesticide treatment [28, 36, 56], and dsRNA and CSBV-infected treatment [53]. It should be noted that some exceptions exist in certain conditions, e.g. bacterial challenge [58] and across seasons [27, 57, 59]. Taken together, more care should be placed upon usage of these reference genes for target gene expression normalization in A. mellifera at least for the tissues at the developmental stages analyzed in the present study.
Conclusion
We systematically assessed the expression stability of nine candidate reference genes across three tissues (antennae, hypopharyngeal glands, and brains) from adult honeybees at three developmental stages (newly emerged, nurses, and foragers) belonging to two subspecies (A. m. ligustica and A. m. carnica). Comprehensive analysis integrating five statistical algorithms and subsequent validation through mrjp2 expression normalization identified arf1 as the most stably expressed reference gene across all experimental conditions. These findings establish arf1 as a reliable normalization tool for gene expression studies involving tissue-specific development, behavioral plasticity, and subspecies-related differences in royal jelly production in adult honeybees. Conversely, traditional housekeeping genes including α-tub, gapdh, and actin consistently exhibited the lowest stability, rendering them unsuitable for quantitative gene expression analyses under the current conditions.
Data availability
The datasets generated from Sanger sequencing during the current study are available in the NCBI repository, GenBank accession numbers: PV615417-PV615426.
References
Leonhardt SD, Gallai N, Garibaldi LA, Kuhlmann M, Klein AM. Economic gain, stability of pollination and bee diversity decrease from Southern to Northern Europe. Basic Appl Ecol. 2013;14(6):461–71.
대화 참여하기